Dashboard PC / Mac / iOS
Once all the setup is complete and data has been uploaded, Dashboard is the way to access the data for analysis, management, comparison, and action.
Dashboard operates similarly on all platforms. When it is initially launched, Dashboard defaults to the current date. According to the login information it will display all the Panels that have been configured to display for the User defined.
Dashboard Usage
At the top of the Point of Success Dashboard there are a few controls.
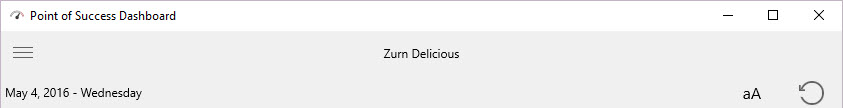
The Date displayed is also a button control that allows the date to be changed to any date. Click the date and change it to view Panels from a different day.
The "aA" button allows the font size to be adjusted. Press the button and then press "a" or "A" to change the font size.
The counterclockwise circle refreshes the data. If the data has been displayed for a period of time and needs to be refreshed, press this button. The data is always refreshed when a new date is chosen or on initial access.
The three lines provided above the data allow access to the login, settings, stores, users, and about information.
Panel Examples
The Panels below are provided for comparison and business analysis. The only Panel that does not provide comparison is the Product Sales by Category - the categories may vary widely between stores and is therefore not useful for comparison.
In these examples there are three stores: BurnZurn (Zurn Grille), Patio Zurn, and TurnZurn (Zurn Food Truck) all under the Zurn Delicious company. Comparisons between the stores and totals help manage the stores individually and help determine where management attention and focus should be.
Hourly Sales
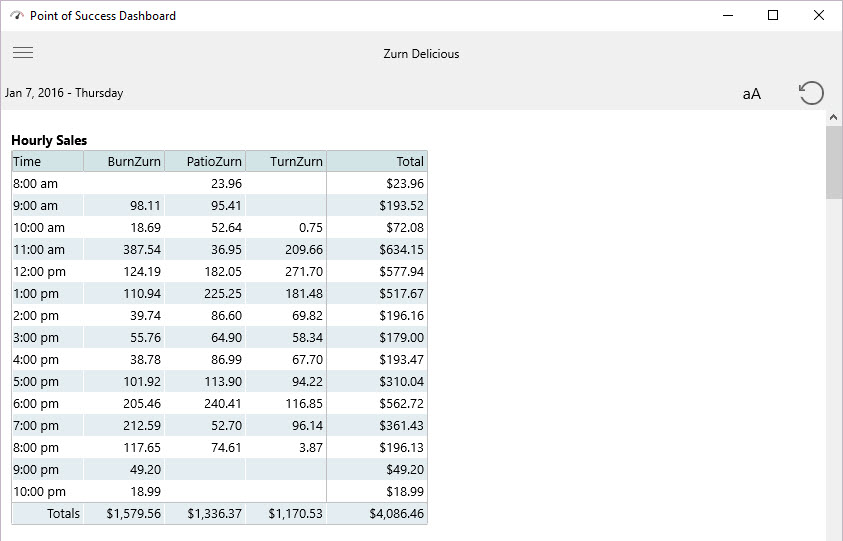
Hourly Sales: Sales by hour with totals by hour and location. Supports multiple locations.
Hourly Labor Cost
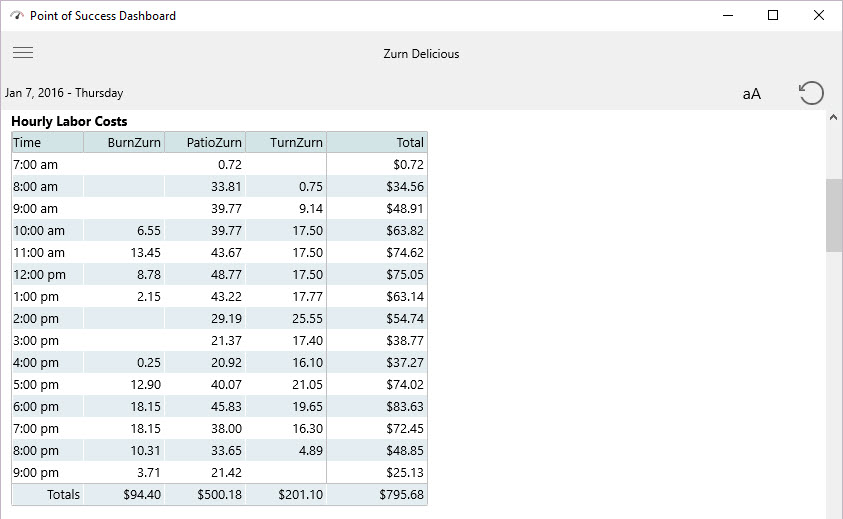
Hourly Labor Costs: Hourly estimate of labor cost for hourly clocked in employees. Supports multiple locations.
Hourly Order Count
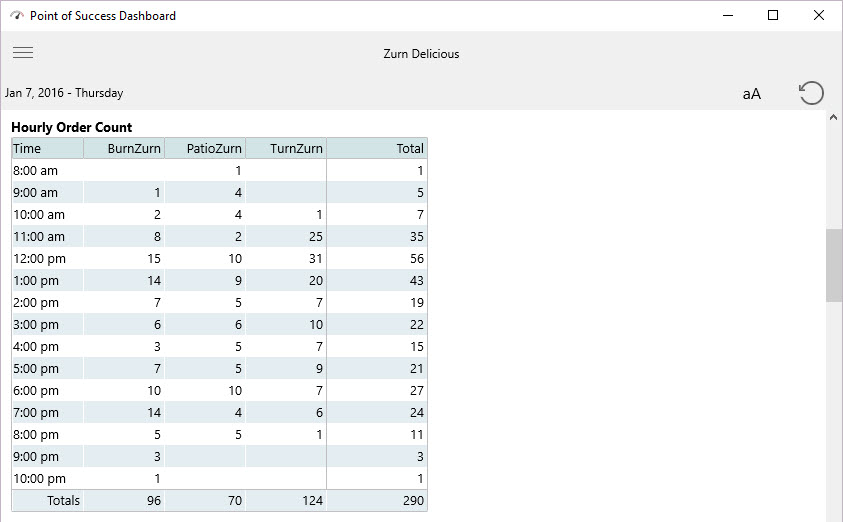
Hourly Order Count: Count of completed orders by hour. Supports multiple locations.
Sales Detail Week to Date
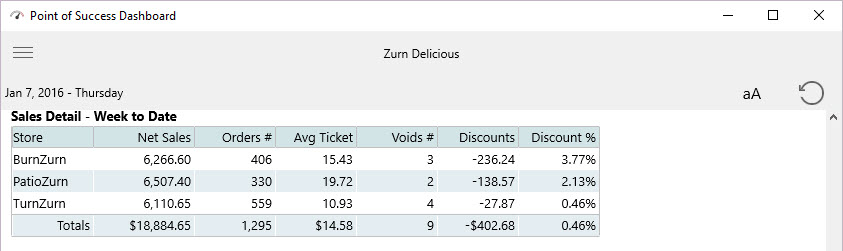
Sales Detail – Week to Date: Net sales, order count, average ticket, number of voided orders, discount and discount percentage. Supports multiple locations.
Sales Detail Month to Date
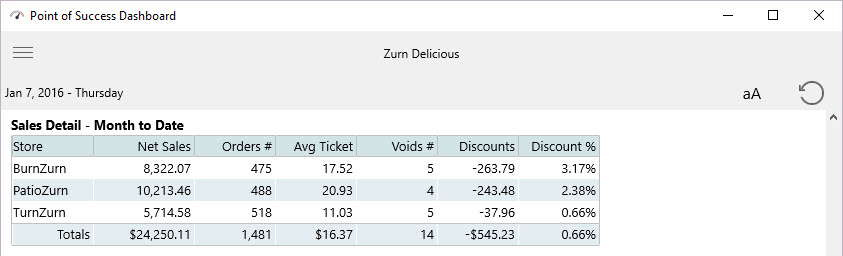
Sales Detail – Month to Date: Net sales, order count, average ticket, number of voided orders, discount and discount percentage. Supports multiple locations.
Historical Data Last Week/Last Month
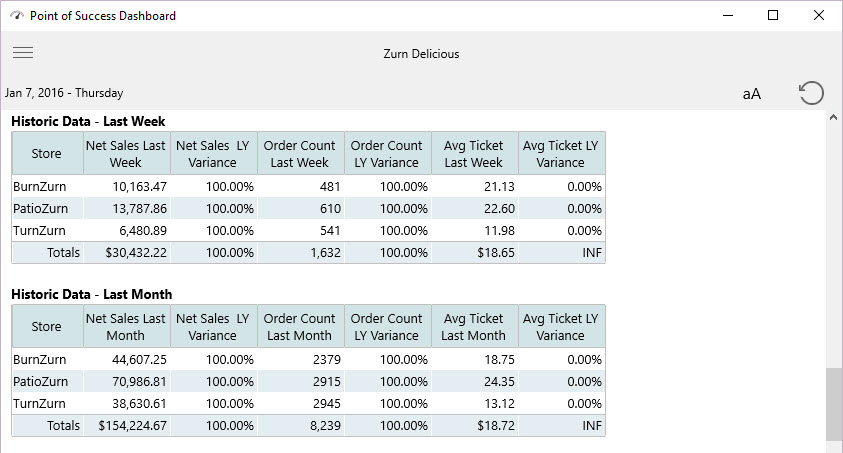
Historic Data – Last Week: Net sales last week, variance of weekly sales during the same week last year, order count, last year variance, average ticket last week and variance from last year. Supports multiple locations.
Historic Data – Last Month: Net sales last month, variance of monthly sales during the same month last year, order count, last year variance, average ticket last month and variance from last year. Supports multiple locations.
Product Sales by Category
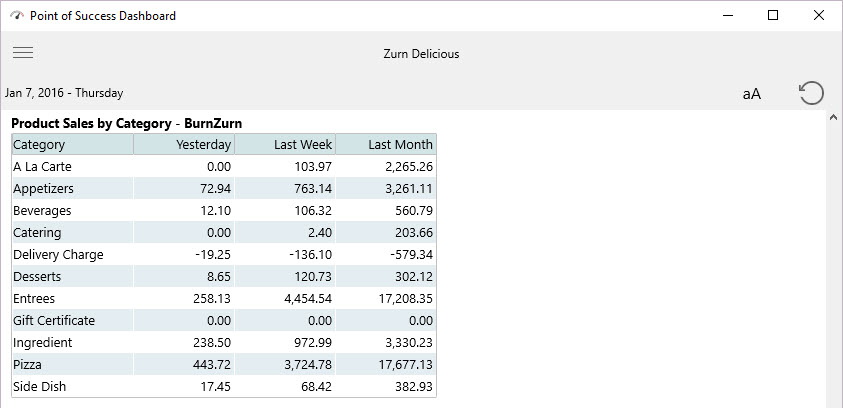
Product Sales by Category: Total sales by product category for yesterday, last week and last month. Supports one store per panel.
Hourly Sales Line Graph
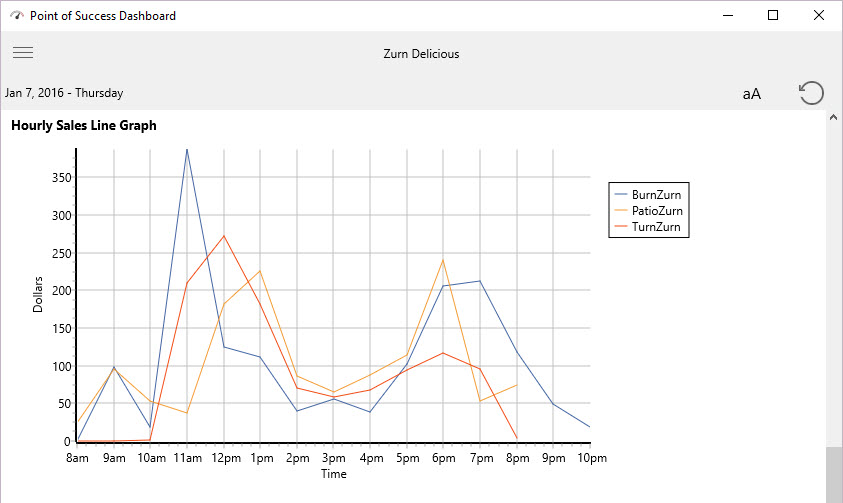
Hourly Sales Line Graph: Hourly sales represented in a line graph. Supports multiple stores.
Labor Cost Line Graph
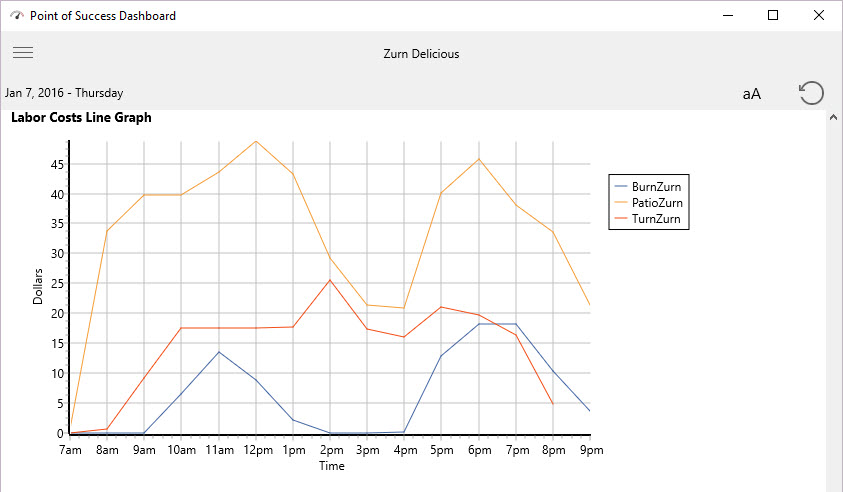
Labor Cost Line Graph: Labor cost line graph by hour for hourly clocked in employees. Supports multiple locations.
Sales Chart Week to Date
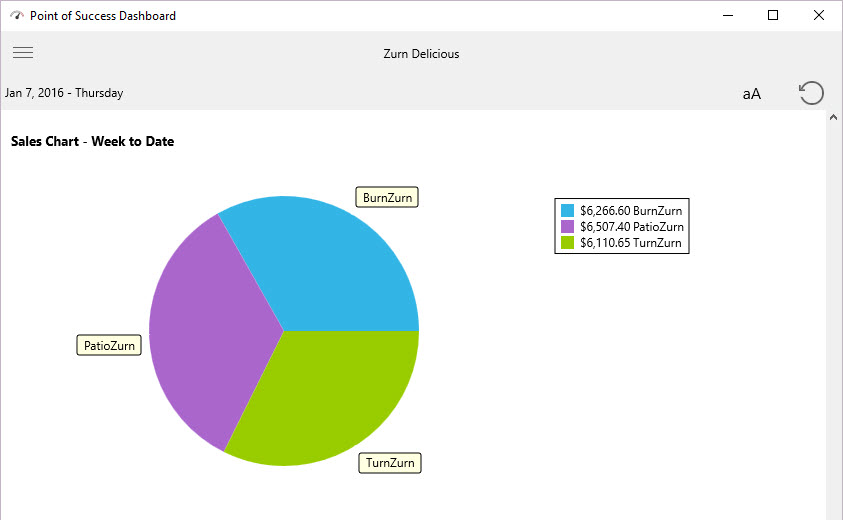
Sales Chart – Week to Date: Week to date sales in a pie chart. Supports multiple stores for comparison.
Sales Chart Month to Date
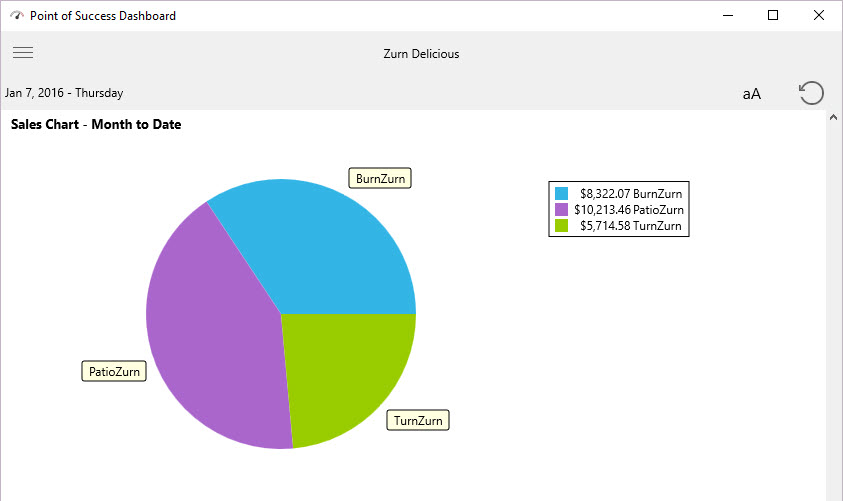
Sales Chart – Month to Date: Month to date sales in a pie chart. Supports multiple stores for comparison.
Category Sales Chart
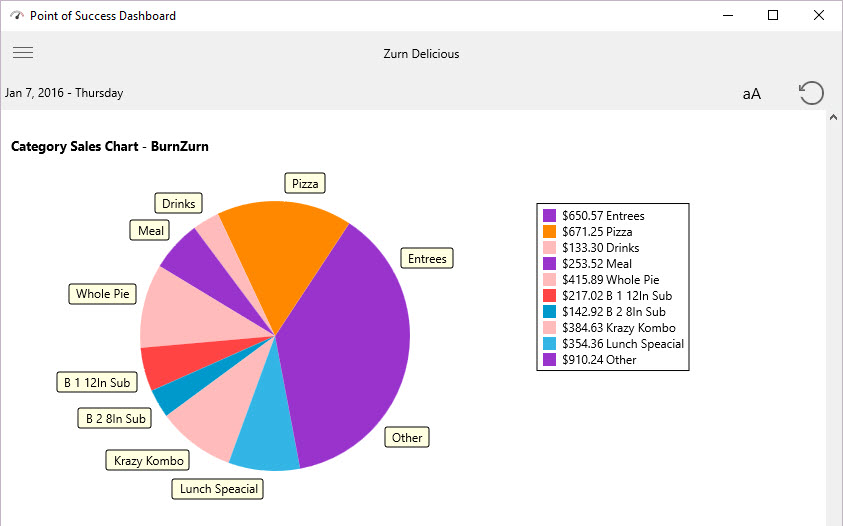
Category Sales Chart: Pie chart of total sales by product category for one location. Set up a panel for each store.
Hourly Sales Bar Chart
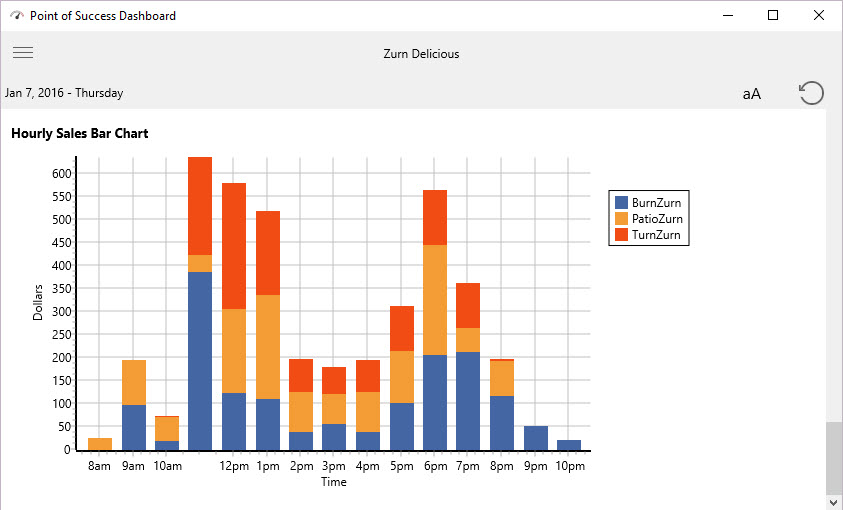
Hourly Sales Bar Chart: Stacked bar chart for sales by hour of the day. Supports multiple locations.